Showing posts with label Power BI. Show all posts

Sunday, July 12, 2020

Time Intelligence in Power BI

Today we are gonna talk about the most important aspects - Time Intelligence. In Fact you will most probably use this script in most of the scenarios or analysis you do. The script we are gonna use today is the most common standard and one of the most handy scripts you should use while starting your analysis.

This script creates a date table in an instant according to the time difference of your choice and even lets you choose the FY beginnings. As in if your financial year starts from July or April you can simply let the script know and it will update the whole table accordingly. 


let CreateDateTable = (StartDate as date, EndDate as date, optional Culture as nullable text) as table =>

let

DayCount = Duration.Days(Duration.From(EndDate - StartDate)),

Source = List.Dates(StartDate,DayCount,#duration(1,0,0,0)),

TableFromList = Table.FromList(Source, Splitter.SplitByNothing()),

ChangedType = Table.TransformColumnTypes(TableFromList,{{"Column1", type date}}),

RenamedColumns = Table.RenameColumns(ChangedType,{{"Column1", "Date"}}),

InsertYear = Table.AddColumn(RenamedColumns, "Year", each Date.Year([Date]), type number),

InsertQuarter = Table.AddColumn(InsertYear, "Quarter Num", each Date.QuarterOfYear([Date]), type number),

InsertCalendarQtr = Table.AddColumn(InsertQuarter, "Quarter Year", each "Q" & Number.ToText([Quarter Num]) & " " & Number.ToText([Year]),type text),

InsertCalendarQtrOrder = Table.AddColumn(InsertCalendarQtr, "Quarter Year Order", each [Year] * 10 + [Quarter Num], type number),

InsertMonth = Table.AddColumn(InsertCalendarQtrOrder, "Month Num", each Date.Month([Date]), type number),

InsertMonthName = Table.AddColumn(InsertMonth, "Month Name", each Date.ToText([Date], "MMMM", Culture), type text),

InsertMonthNameShort = Table.AddColumn(InsertMonthName, "Month Name Short", each Date.ToText([Date], "MMM", Culture), type text),

InsertCalendarMonth = Table.AddColumn(InsertMonthNameShort, "Month Year", each (try(Text.Range([Month Name],0,3)) otherwise [Month Name]) & " " & Number.ToText([Year]), type text),

InsertCalendarMonthOrder = Table.AddColumn(InsertCalendarMonth, "Month Year Order", each [Year] * 100 + [Month Num], type number),

InsertWeek = Table.AddColumn(InsertCalendarMonthOrder, "Week Num", each Date.WeekOfYear([Date]), type number),

InsertCalendarWk = Table.AddColumn(InsertWeek, "Week Year", each "W" & Number.ToText([Week Num]) & " " & Number.ToText([Year]), type text),

InsertCalendarWkOrder = Table.AddColumn(InsertCalendarWk, "Week Year Order", each [Year] * 100 + [Week Num], type number),

InsertWeekEnding = Table.AddColumn(InsertCalendarWkOrder, "Week Ending", each Date.EndOfWeek([Date]), type date),

InsertDay = Table.AddColumn(InsertWeekEnding, "Month Day Num", each Date.Day([Date]), type number),

InsertDayInt = Table.AddColumn(InsertDay, "Date Int", each [Year] * 10000 + [Month Num] * 100 + [Month Day Num], type number),

InsertDayWeek = Table.AddColumn(InsertDayInt, "Day Num Week", each Date.DayOfWeek([Date]) + 1, type number),

InsertDayName = Table.AddColumn(InsertDayWeek, "Day Name", each Date.ToText([Date], "dddd", Culture), type text),

InsertWeekend = Table.AddColumn(InsertDayName, "Weekend", each if [Day Num Week] = 1 then "Y" else if [Day Num Week] = 7 then "Y" else "N", type text),

InsertDayNameShort = Table.AddColumn(InsertWeekend, "Day Name Short", each Date.ToText([Date], "ddd", Culture), type text),

InsertIndex = Table.AddIndexColumn(InsertDayNameShort, "Index", 1, 1),

InsertDayOfYear = Table.AddColumn(InsertIndex, "Day of Year", each Date.DayOfYear([Date]), type number),

InsertCurrentDay = Table.AddColumn(InsertDayOfYear, "Current Day?", each Date.IsInCurrentDay([Date]), type logical),

InsertCurrentWeek = Table.AddColumn(InsertCurrentDay, "Current Week?", each Date.IsInCurrentWeek([Date]), type logical),

InsertCurrentMonth = Table.AddColumn(InsertCurrentWeek, "Current Month?", each Date.IsInCurrentMonth([Date]), type logical),

InsertCurrentQuarter = Table.AddColumn(InsertCurrentMonth, "Current Quarter?", each Date.IsInCurrentQuarter([Date]), type logical),

InsertCurrentYear = Table.AddColumn(InsertCurrentQuarter, "Current Year?", each Date.IsInCurrentYear([Date]), type logical),

InsertCompletedDay = Table.AddColumn(InsertCurrentYear, "Completed Days", each if DateTime.Date(DateTime.LocalNow()) > [Date] then "Y" else "N", type text),

InsertCompletedWeek = Table.AddColumn(InsertCompletedDay, "Completed Weeks", each if (Date.Year(DateTime.Date(DateTime.LocalNow())) > Date.Year([Date])) then "Y" else if (Date.Year(DateTime.Date(DateTime.LocalNow())) < Date.Year([Date])) then "N" else if (Date.WeekOfYear(DateTime.Date(DateTime.LocalNow())) > Date.WeekOfYear([Date])) then "Y" else "N", type text),

InsertCompletedMonth = Table.AddColumn(InsertCompletedWeek, "Completed Months", each if (Date.Year(DateTime.Date(DateTime.LocalNow())) > Date.Year([Date])) then "Y" else if (Date.Year(DateTime.Date(DateTime.LocalNow())) < Date.Year([Date])) then "N" else if (Date.Month(DateTime.Date(DateTime.LocalNow())) > Date.Month([Date])) then "Y" else "N", type text),

InsertCompletedQuarter = Table.AddColumn(InsertCompletedMonth, "Completed Quarters", each if (Date.Year(DateTime.Date(DateTime.LocalNow())) > Date.Year([Date])) then "Y" else if (Date.Year(DateTime.Date(DateTime.LocalNow())) < Date.Year([Date])) then "N" else if (Date.QuarterOfYear (DateTime.Date(DateTime.LocalNow()))> Date.QuarterOfYear([Date])) then "Y" else "N", type text),

InsertCompletedYear = Table.AddColumn(InsertCompletedQuarter, "Completed Years", each if (Date.Year(DateTime.Date(DateTime.LocalNow())) > Date.Year([Date])) then "Y" else "N", type text)

in

InsertCompletedYear

in

CreateDateTable


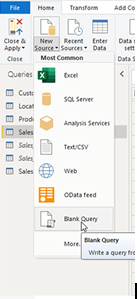
 This will give you an option to choose your starting and ending dates and also to choose your 
FY start period.

Then you can easily see your whole table created and you can use. 
Try it at your end post any queries you have!
Sunday, July 5, 2020

SUMMARIZE AND SUMMARIZECOLUMNS in Power BI

Today we are going to see SUMMARIZE, ADDCOLUMNS and SUMMARIZECOLUMNS:

Extension columns are columns that you add to existing tables. You can obtain extension columns by 
using both ADDCOLUMNS and SUMMARIZE. Basically these functions adds columns / tables over the conditions applied.

For example, the following query adds a Year Production column to the rows returned from the Product table.

EVALUATE
ADDCOLUMNS(
    Product,
    "Year Production", YEAR( Product[Product Start Date] )
)

In below query, you can count the number of products for each product category by using the following query

EVALUATE
SUMMARIZE(
    Product,
    Product[Product Category Name],
    "Products", COUNTROWS( Product )
)


For performance reasons it is better to add ADDCOLUMNS() outside. 

EVALUATE
ADDCOLUMNS(
    SUMMARIZE(
        Product,
        Product[Product Name],
        Product[Product Start Date]
    ),
    "Year Production", YEAR( Product[Product Start Date] )
)
SUMMARIZECOLUMNSReturns a summary table over a set of groups.

Below query returns the sumofsales for calendar year and category name
Summarize =
SUMMARIZECOLUMNS(
    'Calendar'[Year],
    Categories[CategoryName],
    "sumofsales", [Sales])


Thanks, :)

Saturday, July 4, 2020

Some Cool DAX inbuilt functions

Today lets learn about some important and powerful DAX functions which will help you a lot in day to day calculations:

1. CALCULATE - Calculate enables you to do a calculation having any condition applied

For e.g. below measure, calculates YTD Sales for the same period last year period

PY Sales : CALCULATE([YTD Sales],SAMEPERIODLASTYEAR(DimDate[Date]))
Below will do calculation with all product names ignoring any filters: Total Sales : CALCULATE([Total Sales], All(products[productname])) 2. Similarly SAMEPERIODLAST is an intitutive function which lets you choose the exact same period as you see this year

Basically, it returns a table that contains a column of dates shifted one year back in time from the dates in the specified dates column, in the current context.

So in the given measure, before the CALCULATE Function does the calculation,  SAMEPERIODLASTYEAR returns the previous year date from DimDate table. Then Calculation for YTD Sales is done for that year.
PY Sales : CALCULATE([YTD Sales],SAMEPERIODLASTYEAR(DimDate[Date]))
3. ISFILTERED() - can check whether a column is being filtered directly or if any of the columns of the table is being filtered directly.
In the below measure, ISFILTERED() will check if there is a value selected/filtered on the year slicer, the calculation is done, else the string is returned. PY sales no year selected wtext = IF(ISFILTERED(DimDate[Year]),     CALCULATE([YTD Sales],SAMEPERIODLASTYEAR(DimDate[Date])),"Select a year in slicer")
4. HASONEVALUE() - Returns true when there’s only one value in the specified column.

5. FIRSTNONBLANK() and LASTNONBLANK()Returns the first and last value in the column for which the expression has a non blank value respectively.

Calculates the first date which has non blank sales value.
firstnonblank 1 = FIRSTNONBLANK(Sales[Date],SUM(Sales[Sales]))

The below measure calculates, first non blank month which has total sales value

Firstnonblank month = FIRSTNONBLANK(Sales[Month], [Tot sales])


The difference between FIRSTNONBLANK() and FIRSTNONBLANKVALUE()
FIRSTNONBLANK() returns first non blank value of a column, while FIRSTNONBLANKVALUE() returns the first non blank value of an expression. You have to be careful to sort the data on right column and check results.

E.g. gives the first non blank month having the sales 
Firstnonblankvalue year = FIRSTNONBLANKVALUE(Sales[Month], SUM(Sales[Sales]))
Thanks :)

Using aggregate DAX functions

Today we are going to learn some of the most important DAX functions such as SUM, SUMX


1. You can calculate the Total Sales using a normal multiplication (unit price and quantity) and creating a column in the data.

TotSalesColumn = Order_Details[UnitPrice]*(1-Order_Details[Discount])* Order_Details[Quantity]


2. Now you can use SUM function and calculate the total sales
Total Sales = SUM(Order_Details[TotSalesColumn])

Using SUM and SUMX will give the same amount finally, while you have to add one step extra to calculate the total of TotSalesColumn. 
SUMX can directly calculate the Total Sales using Unit price and quantity of order details

3. Total Sales X: SUMX 

Total Sales X = SUMX(Order_Details,Order_Details[UnitPrice]*(1-Order_Details[Discount])* Order_Details[Quantity])


Using most common aggregate functions:

1. MinSale = MIN(EmployeeSales[Sales] 2. MaxSale = MAX(EmployeeSales[Sales]) 3. CountSales = COUNT(EmployeeSales[NewSale])

Finds the standard deviance of selected records
4. StdevPIncome = STDEV.P(EmployeeSales[YearlyIncome]) Finds the statistical variance of selected or some records 5. VarPIncome = VAR.P(EmployeeSales[YearlyIncome]) To find the statistical Variance of complete records 6. VarSIncome = VAR.S(EmployeeSales[YearlyIncome]) Thanks,

Friday, July 3, 2020

Simple Linear Regression in Power BI

The correlation coefficient is a statistical measure of the strength of the relationship between the relative movements of two variables. The values range between -1.0 and 1.0. A calculated number greater than 1.0 or less than -1.0 means that there was an error in the correlation measurement. A correlation of -1.0 shows a perfect negative correlation, while a correlation of 1.0 shows a perfect positive correlation. A correlation of 0.0 shows no linear relationship between the movement of the two variables.

The coefficient of determination, denoted R² or r² and pronounced "R squared", is the proportion of the variance in the dependent variable that is predictable from the independent variable(s).

We shall see how the data is related if we create a scatter plot in power bi

Scatter Plot in Power BI

1. Click the Scatter Plot visualization and add your columns. For e.g. Year Month, Count Days, and Amount to determine the relationship.

2. From the Analytics pane add a Trend Line


There definitely seems to be a correlation between days and amount, so now we will make the calculations to see if we are right.

      Creating the Coefficient of Correlation

  1. Right click on the table and click New quick measure
  2. Select Correlation coefficient from the Calculations under “Mathematical operations”.
  3. Select the Category, Measure X, and Measure Y. These columns will match the dot plot we created earlier.
  4. The Coefficient of Correlation will now be available in your table, and it’s ready for use.

    coefficient of correlation

    Creating the Coefficient of Determination

    In this case, a quick measure would be overkill. The Coefficient of Correlation is notated as the letter R. The Coefficient of Determination is R2.

    Coefficient of Determination = [Coefficient of Correlation]2

    We now have two statistics based on the data set that tells how and to what degree the variables are related.

    coefficient of determination

    As we can see, per our definitions above, both the Coefficient of Correlation and Determination are very close to 1. This means Days is certainly related to Sum of Amount and does a very good job of predicting how much we will spend given the number of days we do something.0

    Simple Linear Regression analysis is quite useful and prevalent across many business cases. Combining it with Power BI can create powerful analytical capabilities.

    Thanks :)